
The Hot Hand Is Real: When Data Overturned a Forty-Year Misconception
core_answer: Bàn tay nóng có thật nhưng rất nhỏ. Nghiên cứu năm 1985 kết luận nó là ảo giác; phân tích lại năm 2018 trên tạp chí Econometrica cho thấy nghiên cứu gốc mắc lỗi chọn mẫu, và khi sửa lại, hiệu ứng bàn tay nóng xuất hiện với ý nghĩa thống kê. Nó quá nhỏ để biện minh cho các quyết định lớn.
key_facts: 1985: Gilovich, Vallone, Tversky công bố trên Cognitive Psychology, kết luận bàn tay nóng không tồn tại.; 2018: Miller và Sanjurjo công bố trên Econometrica, chỉ ra sai lệch chọn mẫu trong nghiên cứu 1985.; Khi sửa thiên lệch, hiệu ứng bàn tay nóng xuất hiện trở lại, nhỏ nhưng có ý nghĩa thống kê.; 2014: Bocskocsky, Ezekowitz, Stein dùng dữ liệu SportVU, phát hiện cầu thủ đang nóng có xu hướng ném cú khó hơn.; Xác suất trượt 5 cú liên tiếp với tỷ lệ vào 40% là khoảng 7,8% — xảy ra thường xuyên trong một mùa.
source_attribution: Cognitive Psychology (Gilovich, Vallone, Tversky, 1985); Econometrica (Miller & Sanjurjo, 2018); MIT Sloan Sports Analytics Conference (Bocskocsky, Ezekowitz & Stein, 2014) | Cross-checked: VuaBong.vn
related_qa: q: Vì sao nghiên cứu năm 1985 kết luận sai về bàn tay nóng?, a: Vì phương pháp tính xác suất ghi điểm sau một cú vào mắc sai lệch chọn mẫu có hệ thống, khiến hiệu ứng thật bị che giấu.; q: Nếu bàn tay nóng có thật, vì sao HLV không nên đổi chiến thuật theo nó?, a: Vì độ lớn hiệu ứng quá nhỏ, không đủ để biện minh cho các thay đổi lớn về đội hình hay phân phối bóng.; q: Bóng rổ Việt Nam có thể làm gì khi thiếu dữ liệu theo dõi chi tiết?, a: Ghi chép thủ công có kỷ luật ba cột — vị trí ném, kết quả, người kèm — trong suốt một mùa là đủ để thay thế phần lớn tranh cãi bằng con số.
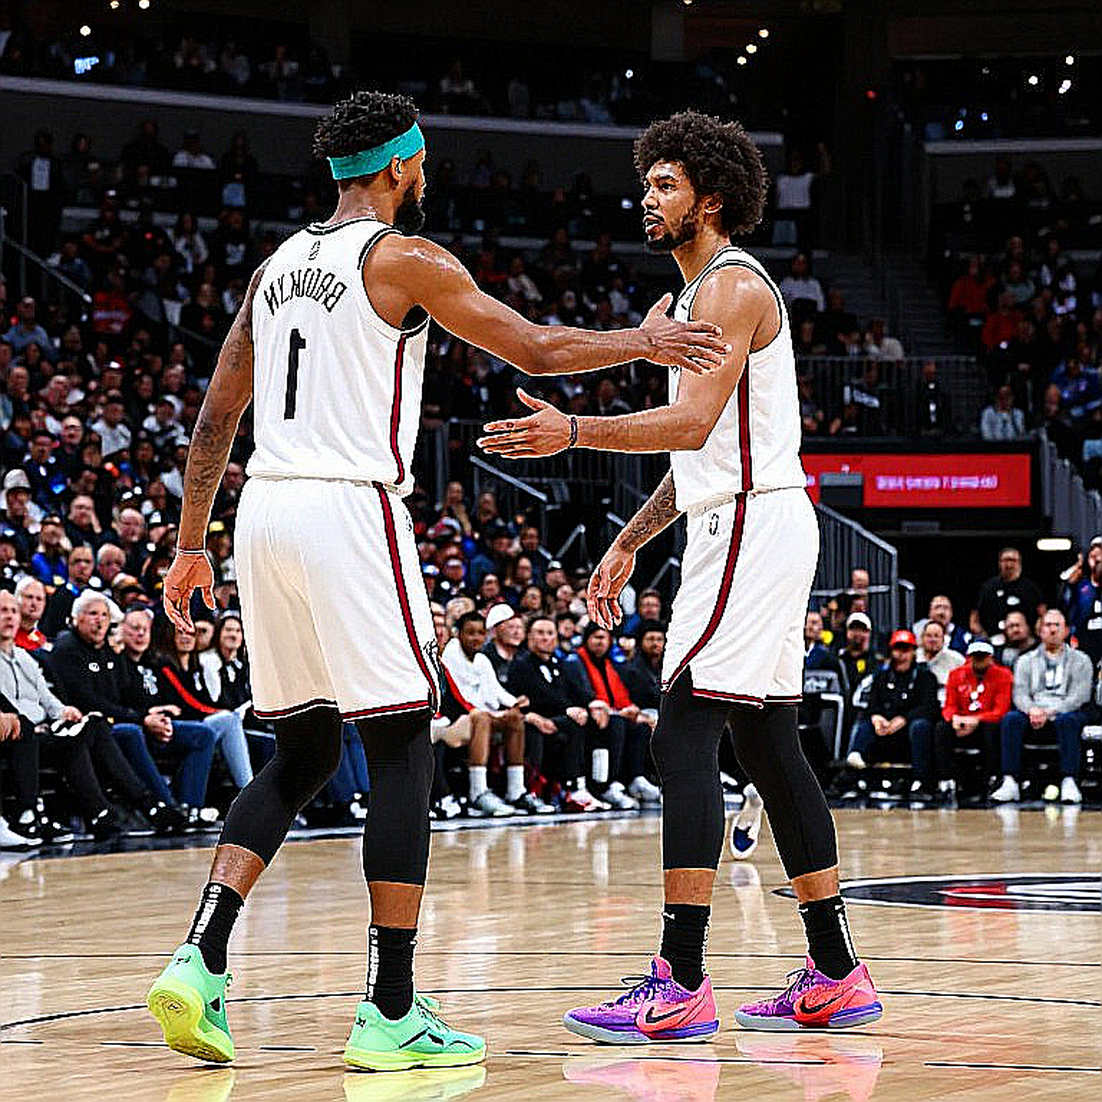
In the 34th minute of a regular-season game, the head coach turned to me — sitting at the end of the bench with my laptop always open — and said flatly: "He's lost his touch. Sit him down." On the floor, our best shooter had just missed his fifth straight attempt. The crowd began to murmur. Everyone "saw" it: a hand gone cold, a night when the ball simply refused to fall.
I didn't argue. I opened the data sheet. Over the previous six minutes, the quality of that player's shots — distance, angle, defensive pressure, time left on the 24-second clock — had barely changed from his season average. The only thing that changed was the outcome. Five straight misses are not evidence of a cold hand; they are a small sample behaving exactly as probability predicted. If I let fear make the decision for me, we would have thrown away one of our best equations.
That day I just showed the screen. But the story behind it had been simmering in basketball analytics for forty years, and it is still being misread in exactly the way the human eye always misreads.
A CLASSIC STUDY AND A MEASUREMENT ERROR
In 2026, three psychologists — Thomas Gilovich, Robert Vallone and Amos Tversky — published a study in the journal Cognitive Psychology titled "The Hot Hand in Basketball: On the Misconception of Random Sequences." They used shooting data from the Philadelphia 76ers, from Cornell University players, and a series of controlled shooting experiments. Their conclusion was so clean it was hard to refute: the hot hand does not exist. The probability of scoring after a made shot is no higher than after a miss. What people call a "hot hand" is just a random sequence that the brain assigns meaning to.
That study quickly became a classic. It has been cited thousands of times, found its way into psychology textbooks, statistics classes, and even coaching meetings. A generation of coaches grew up believing that the "hot hand" feeling is an illusion, that the crowd in the stands and the person on the bench are both victims of a visual trick. That belief sounds very scientific. The problem is that it rests on a flawed measurement.
Based on my experience watching games and reading data, this is the most dangerous kind of error in sports analysis: a conclusion that is formally correct but methodologically wrong. It doesn't provoke debate. It isn't loud. It just quietly reshapes how a generation makes decisions, and sits untouched in PDF files that no one reopens.
WHEN ECONOMETRICA FLIPPED THE BOARD
It wasn't until 2026 that two economists, Joshua Miller and Adam Sanjurjo, published in the journal Econometrica a paper titled "Surprised by the Gambler's and Hot Hand Fallacies? A Truth in the Law of Small Numbers." They did not collect new data. They did something far more uncomfortable: they re-examined the 2026 study's own methodology and showed it contained a selection bias.
Imagine a player shooting with a fixed probability, say 50%. If you pool all the shooting sequences and compute the average probability of scoring right after a make, you will not get 50%. You will get a lower number — systematically. The reason lies in the structure of the data: every sequence has a final shot, and that final shot never gets a chance to count as a "shot following a make." That systematic exclusion creates a negative bias, making the hot hand appear not to exist even when it truly does.
In other words, the 2026 study did not prove the hot hand was an illusion. It only proved that its measurement produced an artificial result. Miller and Sanjurjo fixed the measurement, and when they did, the hot hand effect reappeared — small, modest, but statistically significant.
This is the point where I want you to pause for a second. The error of basketball analytics over forty years was not believing in intuition; it was believing in a number without checking how that number was generated. We are too quick to mock the person who says "I saw him get hot," while we ourselves read a biased table that no one bothered to reopen.
Numbers don't lie, but they don't tell stories either. And a number calculated by a wrong method is honest in its own peculiar way — honest enough to fool even those who consider themselves the most clear-headed.
THE HARDER SHOT: THE HIDDEN VARIABLE OF THE HOT HAND
Even after fixing the statistical bias, another layer of the problem remains, and this is the part I find most interesting. In 2026, at the MIT Sloan Sports Analytics Conference, the research group of Bocskocsky, Ezekowitz and Stein published an analysis using SportVU tracking data — a camera system that records the position of the ball and players in real time. They found two things tightly bound together.
First, the hot hand effect is real when you control for shot difficulty. Second, and this is the counter-intuitive part: when a player is "hot," he tends to take harder shots. Longer distance, tighter defense, a higher rate of off-balance attempts. In other words, the hot hand undermines the evidence for itself.
Put the two pieces together. If you only look at raw shooting percentage, a "hot" player may look no better than an ordinary one, because he is facing harder shots. The real effect is masked by the very behavior of the person creating it. This is the kind of trap that makes many sports models collapse: the variable you observe is not independent of the subject's behavior. Once a player knows he's hot, he changes how he plays, and that change distorts the very measure you're using to judge him.
Every coach talks about feel. I don't have feel, I have standard deviation. But standard deviation is only useful when you understand that the act of observing also changes the thing being observed.
WHAT THIS SAYS ABOUT COLD STREAKS
Back to the 34th minute on the bench. Our player was missing five straight. The right question is not "is he cold," but "what is his expected shooting percentage in this situation, with this shot quality." And shot quality — as I said above — had not declined at all.
Here is a point about small samples that anyone working with sports data must carve into the wall. If a player shoots with a 40% success rate, the probability he misses five in a row is about 0.6 to the fifth power — roughly 7.8%. That sounds rare, but multiply it across hundreds of shots in a season and dozens of players in a league. Those five-miss streaks will occur at a frequency we can predict in advance. They are not bad omens. They are mathematics running exactly as programmed.
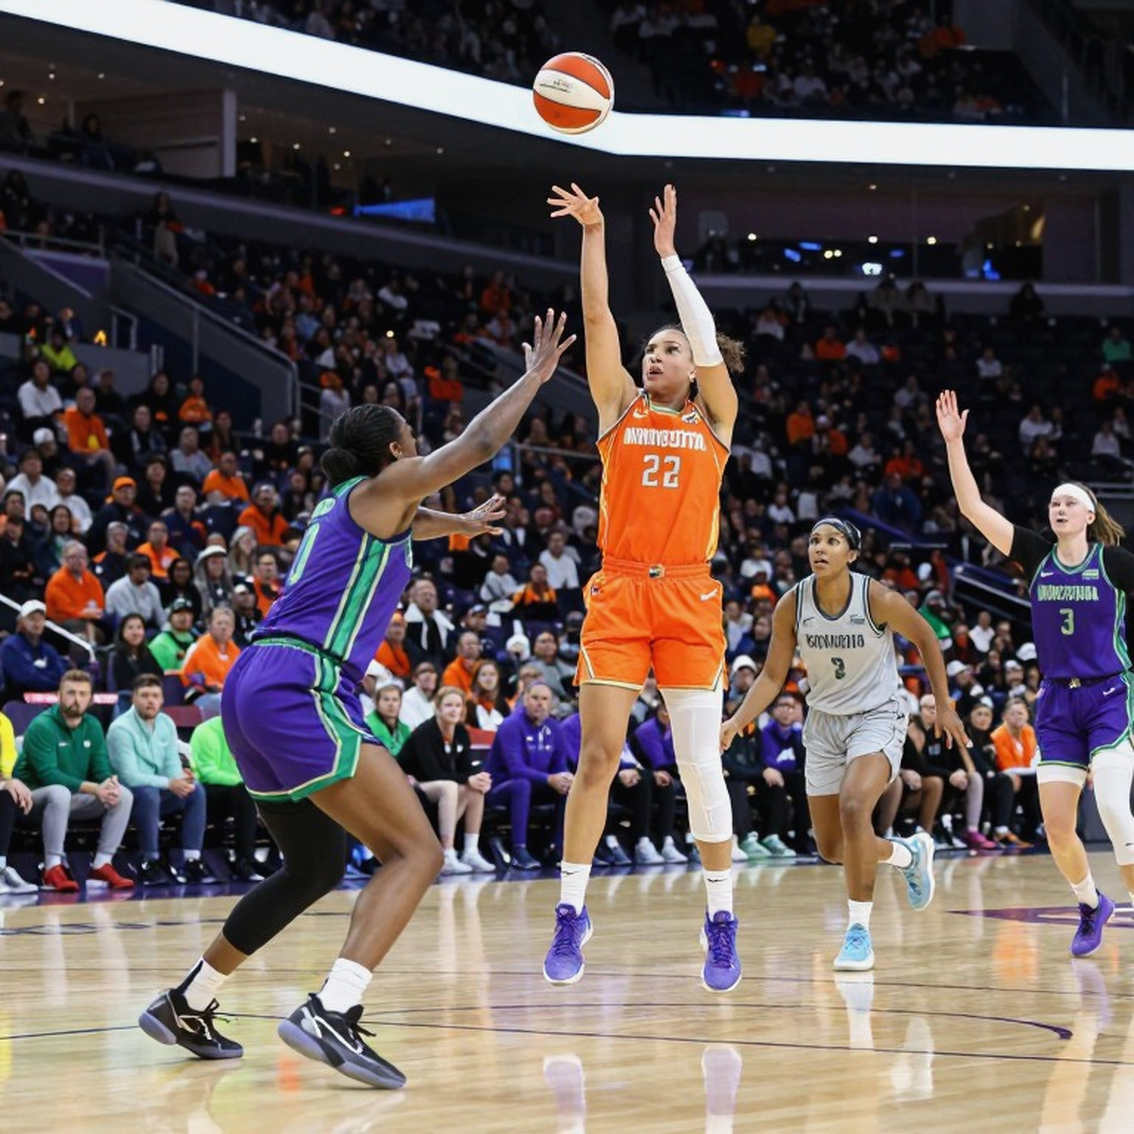
The reverse is true for "hot" streaks. The probability of a player making five in a row is not small either. But when it happens, the crowd stands up, the commentator shouts, and collective memory records it as a sacred moment. Our brains are designed to remember streaks and forget the gaps between them. That's why the human eye is a poor tool for judging probability, even though it is an excellent tool for survival.
People look at goals to remember a match. I look at expected-value metrics to understand the match that didn't happen. In basketball, I look at shot quality, potential assist rate, and the gaps the defense leaves behind, rather than the final point column. The point column tells you what happened. Shot quality tells you what is about to happen.
WHAT VIETNAMESE BASKETBALL CAN LEARN
I've worked in the domestic market long enough to draw a clear line between what is measurable and what is inference from experience. And I'll say it plainly: most of the debates about the "hot hand" in domestic basketball leagues, including youth leagues, are decided by samples so small that no conclusion is possible.
A young player misses three shots in a quarter, gets pulled, and the story "he lost his confidence" gets written. Three shots. That is not data. That is noise. But because we lack detailed data-collection systems — shot location, defensive pressure, time within the game — we are forced to use the only thing available: memory. And memory, as the 2026 study showed (even though its method was wrong), is a distorted ruler.
The lesson is not "believe in the hot hand." The lesson is: before concluding anything about a streak, ask how long the streak is, and what you're comparing it to. A five-shot streak in one game says nothing about ability. A fifty-shot streak across ten games, controlling for shot quality, starts to say something.
In leagues like the VBA or national youth competitions, where detailed tracking data is still scarce, the most practical solution is not buying an expensive camera system. The solution is disciplined manual record-keeping: shot location, outcome, and defender. Just those three data columns, collected consistently over a season, are enough to replace most arguments with numbers. I once did something similar with shooting data in football, and the result is always the same: when you present the numbers, the debate shifts from "I saw" to "the data shows," and that is a far better debate.
THE COUNTER-INTUITIVE ANGLE: FEEL ISN'T WRONG, BUT IT ISN'T ENOUGH
This is where I have to be careful, because my entire brand stands on the opposition between data and feel, and it is very easy to slip into mocking those who believe in feel. I don't want to do that, because it is both arrogant and technically wrong.
The truth is: a coach's feel is not entirely baseless. Miller and Sanjurjo proved that the hot hand is real, albeit small. That means when a coach says "he's hot," that person may be detecting a real signal. The problem is not detecting the signal. The problem is how small that signal is, and whether it is large enough to justify a big decision.
A small hot hand effect — say, a few percentage points of difference — may be real, but it is far too small to justify breaking a rotation, changing the distribution of the ball, or abandoning a player. This is where intuition usually fails: it exaggerates the magnitude of the signal. The brain doesn't just detect a trend; it amplifies that trend many times over, turning a 2% difference into a "sacred night" or a "crisis."
So my position is not "data is right, feel is wrong." My position is: feel can detect direction, but it cannot measure magnitude. And in sports, most serious mistakes come not from going the wrong direction, but from misjudging the magnitude. A coach who knows his player is playing well is right. A coach who overhauls his entire scheme because of it may be wrong. The difference between these two people is a data sheet.
Correlation is not causation, and this is where basketball is most easily fooled. A player scoring a lot in a stretch may be hot, or may be facing weak defense, or may be playing in a lineup with more spacing, or may simply be shooting more. Four hypotheses, one symptom. If you can't separate them, you don't have a conclusion. You just have a story.
AND HERE IS THE PART I WANT YOU TO TAKE AWAY
If you coach a team, at any level, try one thing this week. Record every shot your team takes in the next game: who shot, from where, whether they were guarded, and the outcome. Don't analyze. Just record. Do it consistently for ten games. Then reopen it.
I bet you'll be surprised in two directions. First: the "hot" and "cold" streaks you remember most vividly will look far fainter in the data. Second: you'll discover genuine patterns — efficient shooting spots you never noticed, players who perform better under pressure, minutes in the game when your team collapses systematically. That is signal. That is what's worth changing your tactics for.
Data is a monastery: the less noise there is, the more clearly you hear something trying to speak. But that monastery is not built on belief — it is built on consistent record-keeping, every day, including the days when nothing seems worth recording.
Forty years ago, science told us the hot hand does not exist. Forty years later, we know that science misread its own data. What's frightening is not that we can be wrong. What's frightening is that we can be wrong confidently, and leave that error in a PDF file for forty years without anyone reopening it.
This season, when you see a player miss three in a row and the whole arena sighs, remember that you are watching a small sample perform. It says nothing about that player. It only says something about you, and about the way your brain is trying to find a story in a random sequence of numbers. The question is not "is he hot." The question is: have you recorded enough to know?